Kultranz is an independent data project covering US pay, cost of living, and take-home pay. Everything we publish is computed from official government datasets with a documented methodology. This page is for journalists, podcasters, and researchers who need numbers, charts, or a source on deadline.
What we can comment on
- US pay vs cost of living. How far a salary actually goes in a given metro. We maintain cost-adjusted “real pay” figures for 20 occupations across 50 metros (996 occupation-metro pairs), built on BLS wage data and BEA Regional Price Parities.
- State tax changes for 2026. We compute take-home pay for all 50 states plus DC using the 2026 federal brackets (IRS Rev. Proc. 2025-32), FICA, and each state’s own schedule. We track and correct state schedules when legislatures change them.
- Metro comparisons. Equivalent-salary, price-level, and home-affordability comparisons between any two of 50 major US metros.
- Salary percentiles. Where a given salary sits (10th through 90th percentile) for a specific occupation in a specific city, from BLS OEWS microdata tables.
- Paycheck mechanics. Gross-to-net math: federal brackets, standard deduction, Social Security to the 2026 wage base, Medicare, and state income tax.
The data behind the numbers
Every figure traces to a named public source. No survey panels, no self-reported salaries.
| Dataset | What we use it for | Where it lives |
|---|---|---|
| BLS Occupational Employment and Wage Statistics (OEWS) | Average and percentile wages by occupation and metro | bls.gov/oes |
| BEA Regional Price Parities (RPP) | Cost-of-living index by metro (US average = 100) | bea.gov, via FRED |
| US Census American Community Survey (ACS) | Median home values, rents, household income | census.gov/programs-surveys/acs |
| IRS Rev. Proc. 2025-32 | 2026 federal brackets and standard deduction | irs.gov |
| Social Security Administration | 2026 FICA rates and wage base | ssa.gov/oact/cola |
| Tax Foundation 2026 state tables | State income tax brackets and deductions | taxfoundation.org |
We also publish free dataset extracts on Kaggle and Hugging Face, and a public API at api.kultranz.com for programmatic checks.
Five charts you can embed
All charts are free to reproduce with attribution (“Chart: Kultranz” plus a link). WebP, 1200x630, no sign-up needed - right-click or hotlink.
| Chart | What it shows | File |
|---|---|---|
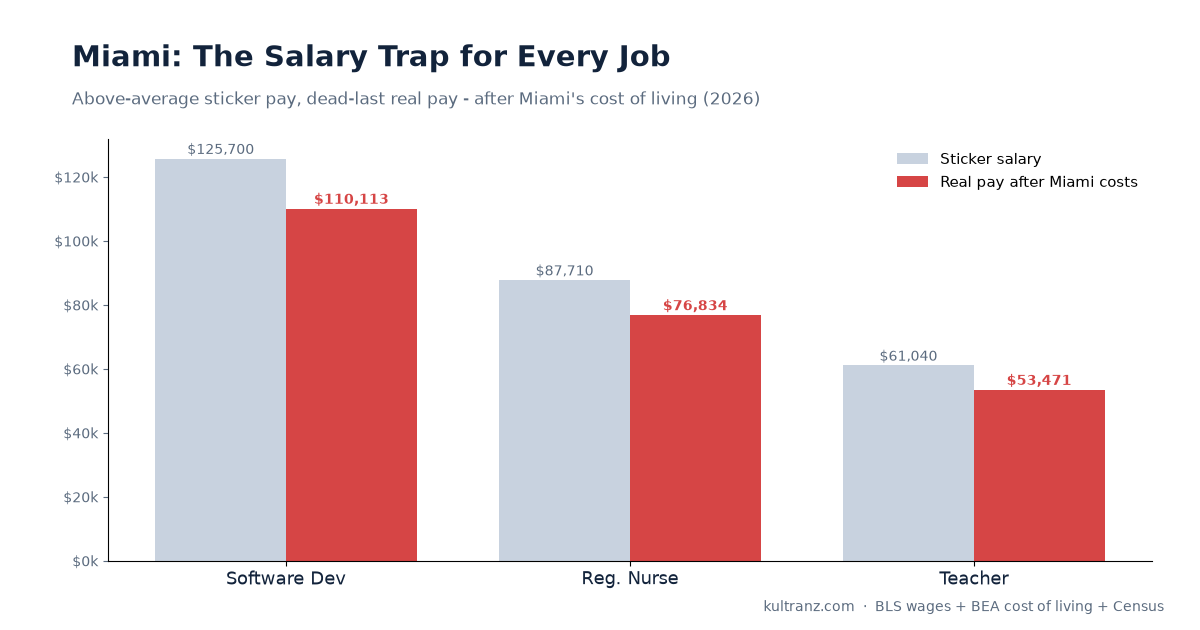
| The Miami salary trap | Sticker pay vs real pay for 20 jobs in Miami | miami-salary-trap-2026.webp |
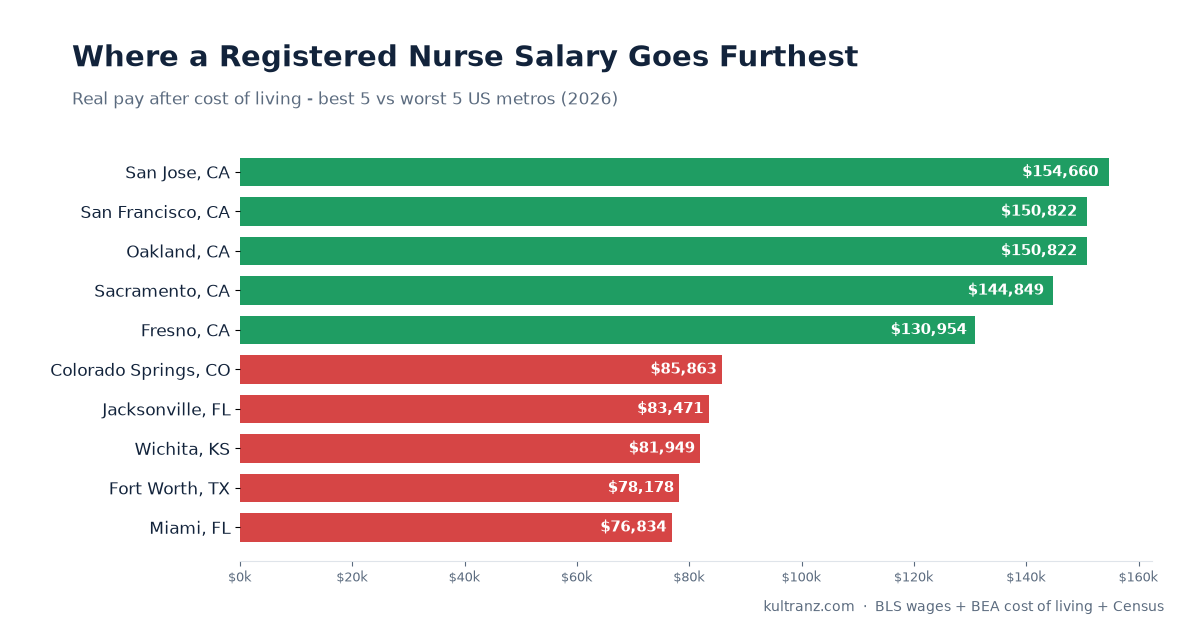
| Nurse real pay by metro | Best and worst of 48 metros after cost of living | registered-nurse-real-pay-2026.webp |
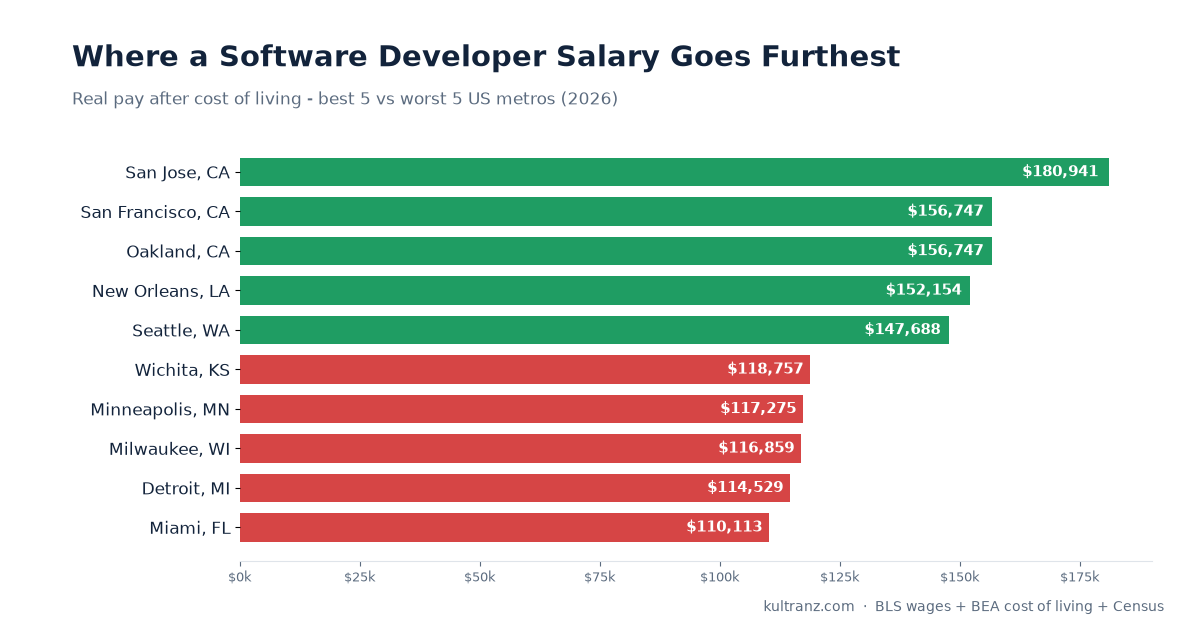
| Developer real pay by metro | The ranking flip: New Orleans near San Francisco | software-developer-real-pay-2026.webp |
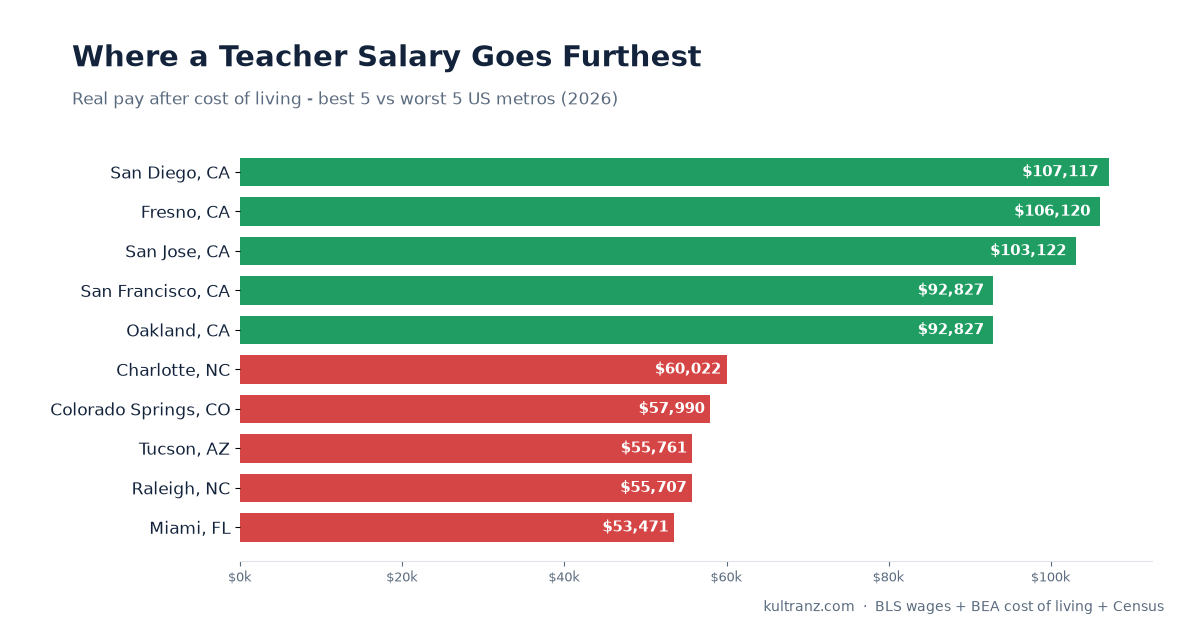
| Teacher real pay by metro | California pays most; homes run 8-13x salary | teacher-real-pay-2026.webp |
| The $100k real-pay map | What $100k becomes in all 50 metros | 100k-real-pay-map-2026.webp |
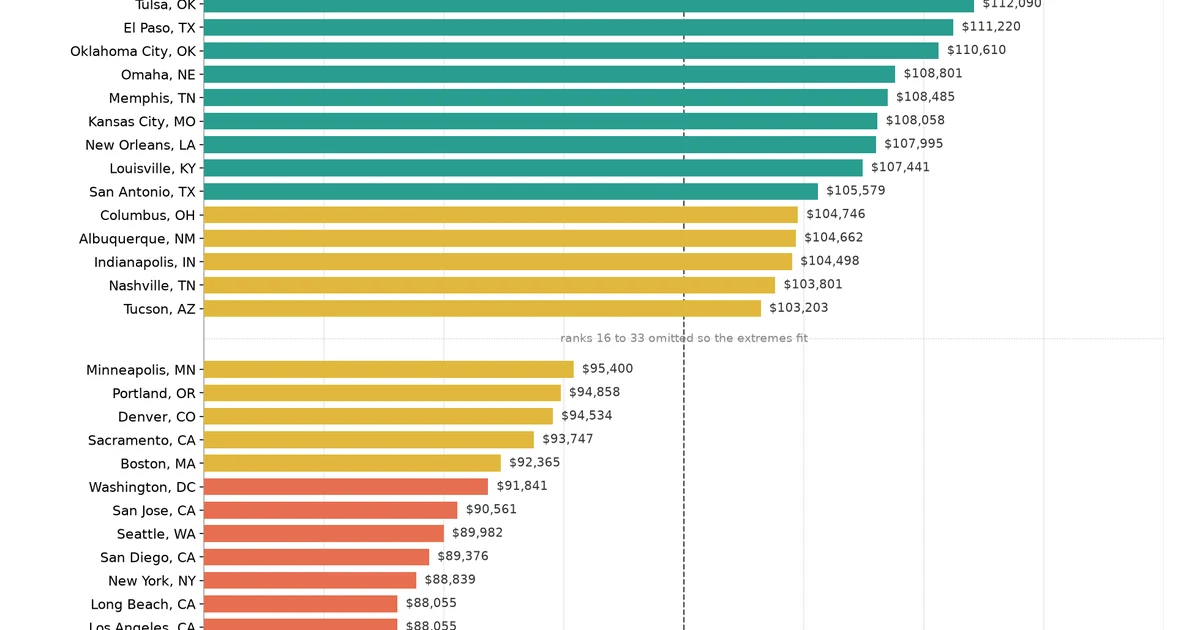
Underlying studies: Miami salary trap, nurse pay, developer pay, teacher pay, $100k real-pay map.
Numbers you can quote
A sample of verified figures from our data. Each links to the study it comes from.
- The same $100,000 salary is worth $112,428 in Wichita and $86,495 in San Francisco - a $25,933 annual gap from geography alone. Study
- Real pay for the identical software developer job swings 64% by metro: $110,113 in Miami vs $180,941 in San Jose. Study
- A $75,000 single filer takes home $61,592 in nine no-tax states and $55,604 in Oregon; federal tax and FICA are identical everywhere. Study
- In Miami, 18 of 20 occupations pay below the national average wage before the city’s 14% cost premium even applies. Study
- A bottom-decile nurse in San Jose ($119,220 at the 10th percentile) out-earns a top-decile nurse in Miami ($110,330 at the 90th). Data
Maintained data, not set-and-forget
We re-verify schedules against primary sources and publish corrections. In October 2026 we corrected three state income tax schedules that other 2026 calculators still carry wrong: Missouri (a graduated 0-4.7% schedule, not a flat 2%), Mississippi (a $10,000 zero bracket before the 4% rate), and Ohio (2.75% applies only above $26,050 under HB 96). If a take-home number looks off in any calculator, ask us - we keep the diffs.
Free custom cuts for your story
On deadline and need a number we have not published? Ask. We can run any of the following, usually within one business day, at no cost:
- Any occupation x metro: average, percentiles, and cost-adjusted real pay
- Any salary x state pair: 2026 gross-to-net breakdown
- Any two metros: equivalent salary and price-level comparison
- Median home value as a multiple of a specific occupation’s local salary
Contact
[OWNER-NAME], [OWNER-TITLE] ([@HANDLE]) - data lead, Kultranz. Commenting on US pay vs cost of living, 2026 state tax changes, and metro comparisons. Responds to media requests same business day.
- Email: [email protected] - put “Press” or the deadline in the subject line
- Data corrections: same address; factual-error reports get priority handling
- Methodology: How every number on Kultranz is computed
All figures are computed from the public datasets listed above; full assumptions and vintages are on the methodology page. Kultranz is an independent data project, not a bank, broker, or advisory service.