The same $100,000 salary is worth $112,428 in Wichita and $86,495 in San Francisco - a $25,933 gap in annual purchasing power from geography alone. Six figures is not one salary. It is fifty different salaries, one per metro, and the ranking of where it stretches furthest is almost the inverse of the salary maps that job seekers usually see.
How we measured it
Each metro in the dataset carries a BEA Regional Price Parity (RPP) index, where 100 is the national average price level. The real value of a $100,000 salary in a metro is 100,000 divided by its RPP, times 100. An RPP of 88.9 (Wichita) means prices run about 11% below the national average, so $100,000 there buys what $112,428 buys at national prices.
All 50 metros in the dataset have a price index, and 962 occupation-metro pairs carry complete wage and price data across 20 occupations (48 metros have all 20). No survey panels, no self-reported salaries - the figures join two federal releases per metro, and the full method is on the methodology page.
The top 10: where $100k stretches furthest
| Rank | Metro | RPP (US = 100) | $100k becomes |
|---|---|---|---|
| 1 | Wichita, KS | 88.9 | $112,428 |
| 2 | Tulsa, OK | 89.2 | $112,090 |
| 3 | El Paso, TX | 89.9 | $111,220 |
| 4 | Oklahoma City, OK | 90.4 | $110,610 |
| 5 | Omaha, NE | 91.9 | $108,801 |
| 6 | Memphis, TN | 92.2 | $108,485 |
| 7 | Kansas City, MO | 92.5 | $108,058 |
| 8 | New Orleans, LA | 92.6 | $107,995 |
| 9 | Cleveland, OH | 93.0 | $107,475 |
| 10 | Louisville, KY | 93.1 | $107,441 |
Every metro in the top 10 runs 6.9% to 11.1% below the national price level. Wichita wins outright: its 11.1% price discount turns $100,000 into the equivalent of a $112,428 salary at national prices. The gap between first and tenth place is $4,987 - the top of this table is tightly bunched.
The bottom 10: where six figures shrinks
| Rank | Metro | RPP (US = 100) | $100k becomes |
|---|---|---|---|
| 41 | Washington, DC | 108.9 | $91,841 |
| 42 | San Jose, CA | 110.4 | $90,561 |
| 43 | Seattle, WA | 111.1 | $89,982 |
| 44 | San Diego, CA | 111.9 | $89,376 |
| 45 | New York, NY | 112.6 | $88,839 |
| 46 | Long Beach, CA | 113.6 | $88,055 |
| 46 | Los Angeles, CA | 113.6 | $88,055 |
| 48 | Miami, FL | 114.2 | $87,600 |
| 49 | Oakland, CA | 115.6 | $86,495 |
| 49 | San Francisco, CA | 115.6 | $86,495 |
The full spread from Wichita to San Francisco is 1.30x. Put differently, a worker taking a $100,000 offer in San Francisco or Oakland over an identical offer in Wichita is accepting a real pay cut of $25,933 a year. The side-by-side of San Francisco vs Tulsa or Kansas City vs New York shows the same gap in line-item prices.
The catch in the middle: cheap metros that still lose
If this were the whole story, the career advice would be simple: move somewhere cheap. The wage data says otherwise. Comparing each metro’s cost-adjusted pay against each occupation’s national average across the 962 complete occupation-metro pairs:
| Cheap metro (RPP under 100) | Occupations paying below national average in real terms |
|---|---|
| Tucson, AZ | 19 of 20 |
| Jacksonville, FL | 19 of 20 |
| Louisville, KY | 18 of 20 |
| El Paso, TX | 17 of 20 |
| Albuquerque, NM | 17 of 20 |
| Nashville, TN | 17 of 20 |
| Memphis, TN | 16 of 20 |
| Wichita, KS | 15 of 20 |
| Oklahoma City, OK | 14 of 20 |
In 19 of the 21 below-average-cost metros with complete wage data, a majority of the 20 occupations pay below their national average even after the cost advantage is applied. Wichita is the star of the $100k table, yet 15 of its 20 occupations land below the national average in real terms - its average cost-adjusted pay across the dataset is $83,986, under the $90,897 national occupation average. The price discount is real; so is the wage discount.
Only 12 of the 48 wage-complete metros clear the national average in cost-adjusted pay, and 10 of those 12 are above-average-cost metros - San Jose, San Francisco, Oakland, Seattle, New York, Washington, Sacramento, Boston, San Diego, and Denver. The only cheap metros on that list are Austin (RPP 98.1) and Charlotte (97.3). Compare El Paso vs San Jose to see the pattern in full: San Jose’s costs are 20 points higher, and its wages more than cover it.
Why nominal and real pay diverge
Across the 48 metros with complete wage data, average nominal pay runs from $71,748 (El Paso) to $134,755 (San Jose) - a 1.88x spread. Price levels run from 88.9 to 115.6 - a 1.30x spread. Wages vary almost twice as much as prices, and the correlation between a metro’s price level and its pay level is 0.84: expensive metros largely buy their cost premium back in salary.
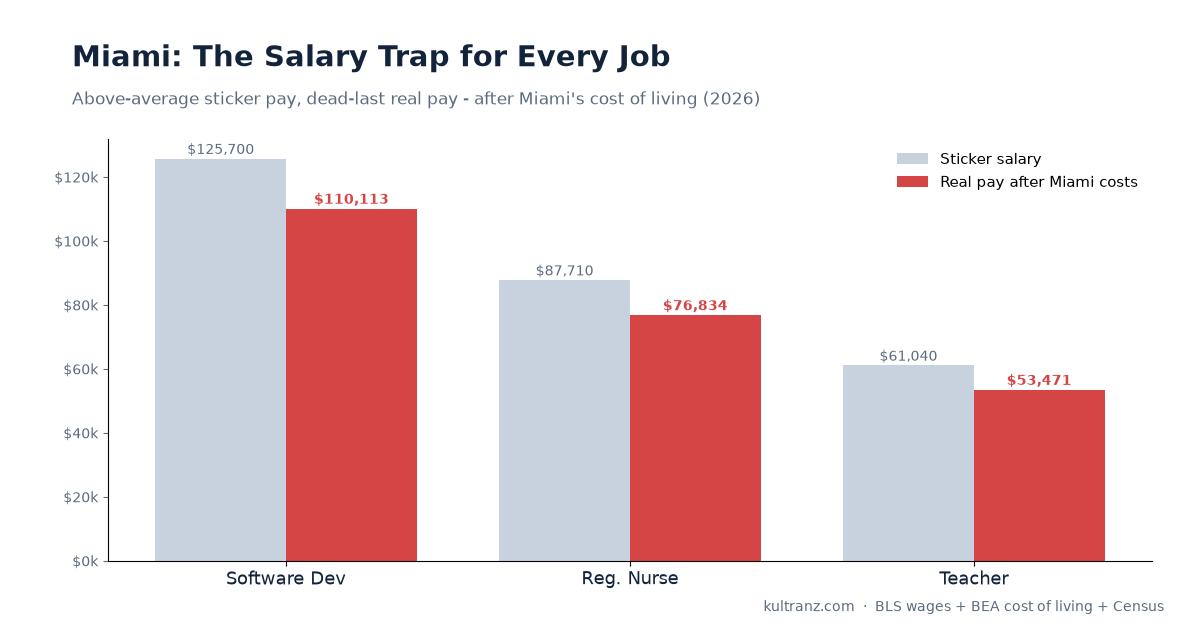
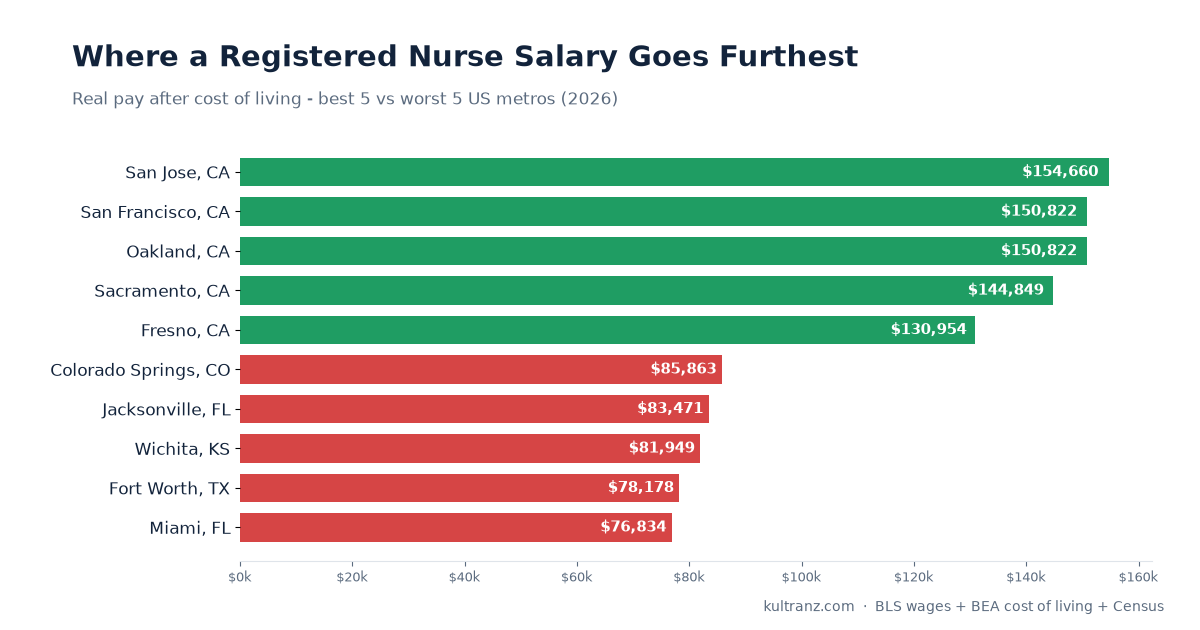
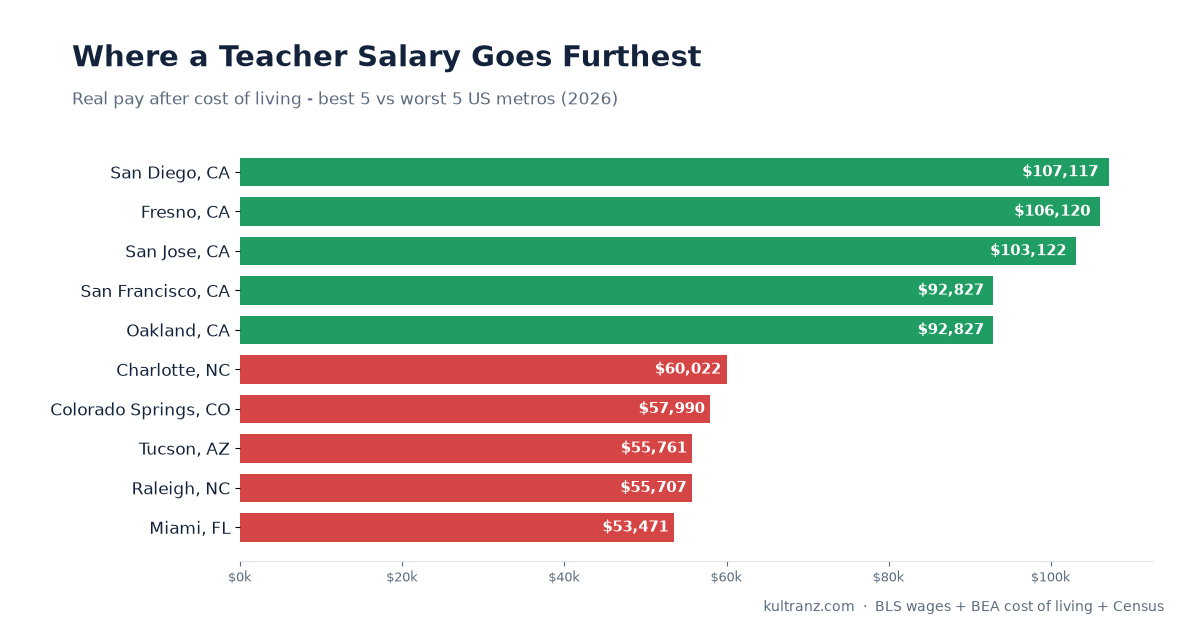
The metros that break the pattern are the ones to watch. Miami ranks 26th of 48 on nominal pay but 48th - dead last - after the cost adjustment, because it pairs below-median wages with the third-highest price level in the dataset (114.2). The Memphis vs Miami comparison captures it: Memphis is 22 points cheaper and pays less, but keeps more of what it pays.
Use it
A $100k offer is a starting point, not a conclusion. Check any two metros side by side with the cost-of-living calculator, or read the full method on the methodology page.
Data: BLS Occupational Employment and Wage Statistics salaries and BEA Regional Price Parities, 2026 vintage - 50 metros, 20 occupations, 962 occupation-metro pairs with complete wage and price data. Figures are estimates from public data, not personalised financial advice.